The process of developing the right scorecard for your business can be frustrating and is a journey. Does any of this sound familiar to you?:
- Am I tracking the right metrics to support my business?
- I have hopeless, long streaks of red for certain metrics on my scorecard.
- Are my metrics at the right level (Leadership, Departmental)?
- Some of my metrics make it difficult to take the proper action.
The purpose of this blog post is to help you break through these challenges. We will:
- Position the difference between leading, lagging, and activity metrics.
- Describe the ideal state of an actionable scorecard.
- Help you determine what metrics should be on your scorecard at what level.
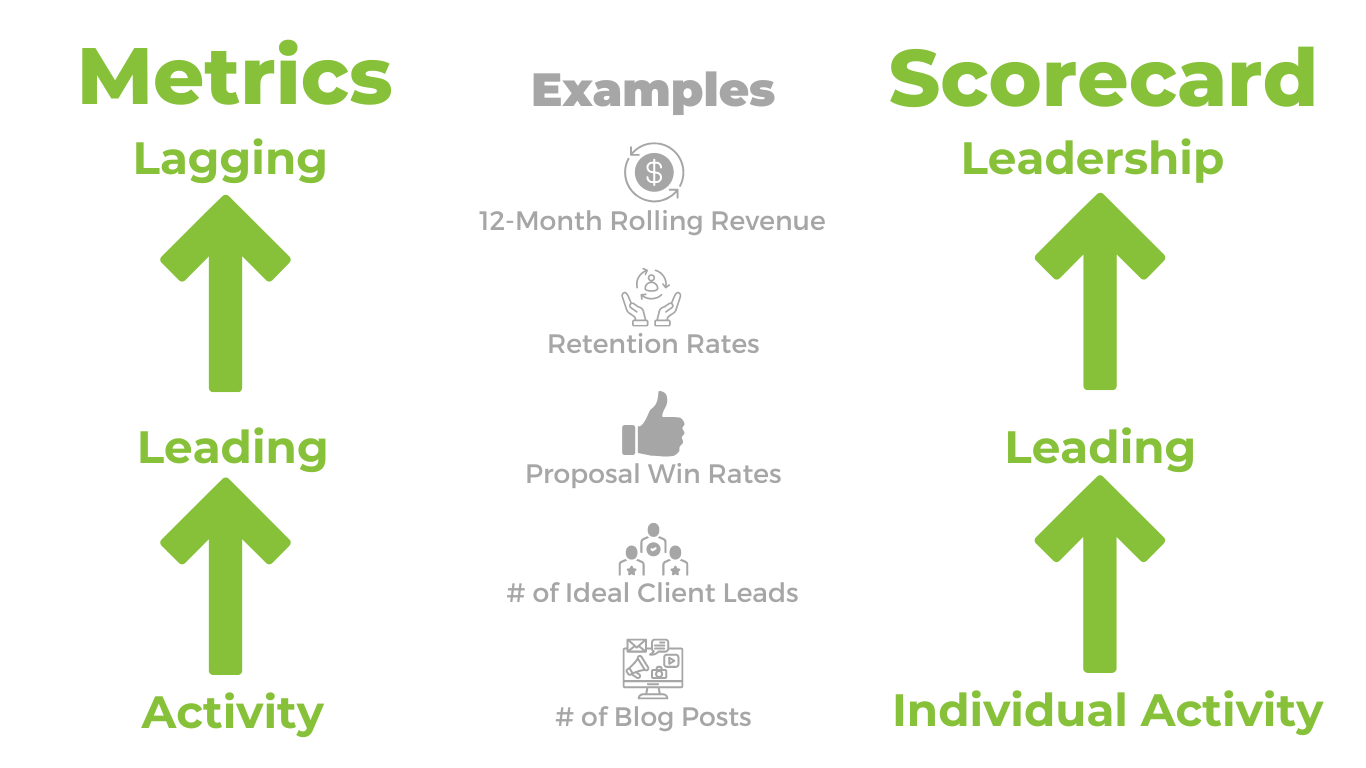
Lagging, Leading, and Activity Metrics
One way to think about metrics is that they are on a vertical spectrum to align with the leadership hierarchy. On the upper end of the spectrum, you have lagging metrics. These are the metrics that you would find on a business plan or V/TO®, and you might also find them on the leadership scorecard. On the lower end of the spectrum, you have activity metrics and would likely see these at the departmental level and also have individuals that own these activity numbers. Leading are on the spectrum and fit somewhere in between. Let’s look at each one:
Lagging Metrics: Lagging metrics are closely connected to the business’s high-level goals. The challenge with lagging metrics is that they are hard to affect on a weekly basis. An example of a lagging metric is 12-month rolling revenue.
Leading Metrics: Leading metrics give you an early indication of whether or not you will be meeting your business goals and lagging metrics. While an early indicator, leading metrics are not always easy to control on a weekly basis. Examples of leading metrics for sales reps would be proposal/win rates or retention rates for an Account Manager position. An example of an operational metric is Onboarding Client Satisfaction.
Activity Metrics: Activity metrics are based on the activities you must do to ensure the leading metrics trend in the right direction and the business goals are met. The idea with activity metrics is to be able to look at your activity metrics when you close out your week on Friday and know if you had a good week. Examples of activity metrics include # of outbound calls made or # of social posts. In short, lagging metrics are what you are trying to achieve, activities are what your team needs to do, and leading metrics let you know if you are getting there. Now that this context is understood, let’s look at the ideal state of a scorecard and what metrics you should be tracking and on what level.

Scorecard – Ideal State
In its purest sense, a mature scorecard consists only of the metrics that you can control on a weekly basis. What is a mature scorecard? A mature scorecard is where the metrics are tight from top to bottom. The activities that you are doing are going to drive the leading metrics that directly drive the lagging metrics and high-level business goals.
So, you should see a lot of activity metrics on departmental scorecards. As you move up toward the leadership level, there are likely fewer activity metrics. That said, any leading metrics should be closer to the activity metrics than the lagging metrics on the spectrum we discussed above.
When you are tracking the right activity and leading metrics, there is limited value in tracking the lagging metrics on a weekly basis, especially when you come down from the leadership scorecard. Until you get to that point, it sometimes helps to have visibility to leading and sometimes lagging metrics.
Lagging metrics on lower level scorecards can have a negative impact because they are not actionable. This is likely the case if you see 13 weeks of red across your scorecard. It is a de-motivator.
When you see long streaks of red or green for activity metrics, you could be tracking the right metrics but not changing the target goals for the metric, making it hard to take the right action. Ensure your goals:
- are achievable goals within reach
- motivate not deflate
What metrics on what level?
Understanding what metrics to put on a leadership scorecard vs. lower-level scorecards can be a big challenge. The rule of thumb is that you should have the metric at a level that can be controlled. For example, # of outbound calls made should not be on the leadership scorecard, and the retention rate should not be on the scorecard for the Sales Development Rep (SDR) team.
Metrics on the leadership scorecard should be actionable for the leader that sits in the seat, even if it is not an activity metric. For example, # of qualified leads could be the primary marketing metric tracked on the leadership scorecard. If that number is off, the sales and marketing leader should know what corrective action their team should take by looking down a level at the sales and marketing scorecard. Activity metrics to support # of qualified leads might be # of calls with referral partners or # of social or blog posts.
As we have said, turning your scorecard into a true asset for your business is a journey. We hope this helps you navigate your journey towards developing a scorecard to drive your business results.


