Want to grow revenue faster? Increase your pipeline velocity by reducing the friction between stages. How do you measure this? Here are two sales pipeline metrics to look at that can make a huge impact on your top line on the P&L:
- Conversion Rate: The % of clients that move from one stage of your pipeline to the next
- Time Spent in Stage: The amount of time that prospects spend in each stage of the pipeline
Stage Conversion Rate
The first thing to measure is the conversion rate between each stage in your pipeline. Simply calculated, what % of clients that come into any stage of the pipeline move to the next stage.
Here is a simple sales pipeline as an example:
- Qualify: 50% of qualify calls result in assessments
- Assess: 75% of assessments lead to proposals
- Propose: 25% of proposals lead to a signed contract and move to implementation
- Implement: 90% of clients finish the implementation and become clients
Most CRMs track these metrics as a default feature, but most sales teams do not closely consider how they can impact Stage Conversion Rate. Let’s look at how a 5% improvement on each stage can impact a business that has 50 opportunities per month move into a pipeline with an average transaction value of $50,000:
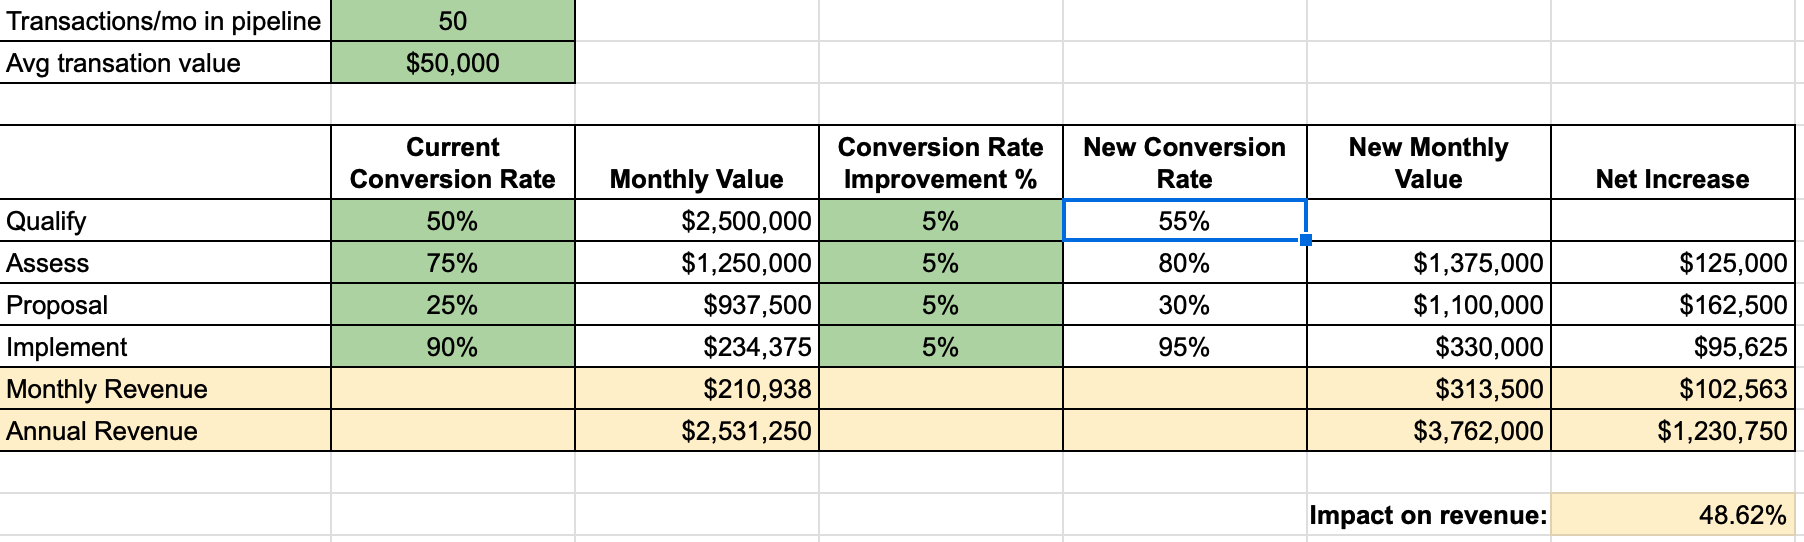
Using those example metrics, only a 5% improvement in each stage results in a 49% impact on Annual Revenue.

Time Spent in Stage
This is not a new metric either, nor is it hard to track. But, few sales organizations consider this metric as a way to impact performance. The time spent in each stage impacts:
- Business cash flow
- Sales productivity
- Cost per transaction
Let’s look at this metric a bit closer using the same simple pipeline example:
- Qualify: 3 days
- Assess: 2 weeks
- Propose (includes Proof-of-concept and negotiation): 2 Weeks
- Implement: 2 Weeks
Fair to say that these 2 metrics have a huge impact not only on your sales team but on your business as a whole. Easy to say, but how to you do it?
How To Reduce Pipeline Friction
Prospects encounter what we call friction as they move through the various stages of their buying process. Friction comes in the form of their own mental blocks that might be typical of each stage, or can unintentionally stem from your sales process. Here is an example of each:
- Mental Blocks: The natural tendency to resist change
- Your Sales Process: A proposal that does not clearly communicate ROI.
There are 2 approaches to minimizing friction to realize the results that you saw when you calculated the impact on your business using the calculator above:
- Align and improve the client experience
- Leverage content that helps your prospects navigate your pipeline
1. Align and Improve the Client Experience
The first step is to create an “ideal client” experience by broadening your sales process in both directions including both your top-funnel lead generation and your client stage of your pipeline. Ensuring that sales, marketing, and even operations are aligned with this experience is the first step in impacting the 2 metrics.
The second step is to have a process in place to continually optimize each stage in your experience to minimize friction to improve conversion rates and minimize the time spent in each stage. This approach will also help improve your actual “client” stage.
2. Leverage Content to Answer Questions
Ensuring your prospects and clients have their questions answered as they navigate your experience is critical to reducing friction. A simple 2 step process can put this into motion:
1. Implement a process for content creation that answers your clients’ questions as they navigate their experience with your organization. This process needs to be implemented into the culture of the organization with input from sales, marketing, and operations.
2. Put a plan in place to ensure the content gets in front of your Ideal Clients and Ideal Prospects. This plan involves leveraging this content in the following areas:
- Website
- Social touchpoints
- Phone prospecting messaging
- Email prospecting messaging
When all are on board with the Client Experience and the content plan around it, your clients have a more positive experience with your business. Maybe just as impactful, your sales team has 1 consistent framework to support clients through their experience as opposed to having 20 different approaches for 20 different reps.
Great News!: The top-funnel leads come as a product of your executing the above plan. What metrics are you tracking to improve your hit rate and accelerate your sales cycles?
Need help calculating the impact of your sales pipeline metrics? Download the worksheet, Calculating Sales Pipeline Metrics Impact.